Operating model and supervision
What the supervision layer must provide for agents: a named sponsor for every agent, oversight sized as a queue for the busiest ten minutes, checks made cheap, and measures that prove oversight is happening.
The operating model and supervision layer (R13) is one of the fourteen layers you already own. It is how people stay in charge of the work. Today it holds control room shifts, work queues with sampled checks, and levels of authority. The utilities and energy research found no role yet that owns an agent's results. For agents, this layer must provide supervision that is sized, easy and proven. Every agent has a named sponsor, set at the second stage of the agent lifecycle. Supervision is sized as a queue, for the busiest ten minutes, with waiting time counted. Checking is made the cheapest action. And supervision itself is measured in production.
What sits in this layer today
Each industry already supervises work done by people and machines. These patterns are a good base for agents. Vendors in brackets are examples, not a claim about any named organisation.
- System category
- Control rooms and operating centres
- Electricity distributor
- Control room shifts with operator authorisation levels
- Water utility
- Treatment plant operators, with the same authorisation pattern
- Hospital network
- A patient flow unit and a virtual care centre
- Generator, oil and gas, or miner
- Control room operators and shift supervisors. Remote operations centres for miners (BHP, Rio Tinto, Fortescue in Perth)
- System category
- Work queues with sampled checks
- Electricity distributor
- Contractor management for vegetation and field work
- Water utility
- Billing operations with team leads and QA sampling
- Hospital network
- Health information management: medical records and coding
- Generator, oil and gas, or miner
- Maintenance planners and schedulers. Assurance
- System category
- Contact and booking centres
- Electricity distributor
- Fault and life support lines on contact centre telephony (Genesys, Amazon Connect, NICE). The retailer takes account calls
- Water utility
- Contact centre workforce management and QA (NICE, Verint, Genesys)
- Hospital network
- A central referral hub and booking centre
- Generator, oil and gas, or miner
- Not in the research
- System category
- Authority and statutory roles
- Electricity distributor
- Operator authorisation levels. The electricity safety management scheme (Victoria)
- Water utility
- The same authorisation pattern as electricity
- Hospital network
- A clinical governance framework (NSQHS Standard 1)
- Generator, oil and gas, or miner
- Delegations of authority. Statutory roles such as a site senior executive. An Offshore Installation Manager
- System category
- IT service management
- Electricity distributor
- ServiceNow, run to ITIL
- Water utility
- ServiceNow, run to ITIL
- Hospital network
- A CIO and digital health division, and a state shared-services body
- Generator, oil and gas, or miner
- ServiceNow
- System category
- AI policy or committee
- Electricity distributor
- In some
- Water utility
- In some
- Hospital network
- An AI governance group
- Generator, oil and gas, or miner
- Not in the research
- System category
- A role that owns an agent's results
- Electricity distributor
- None yet
- Water utility
- None yet
- Hospital network
- Not in the research
- Generator, oil and gas, or miner
- None yet. New roles needed: an agent sponsor, a case reviewer and a review of overrides
Standards and interfaces: ITIL 4 and the ISA-18.2 alarm roles in utilities. Hospitals work to a clinical governance framework under NSQHS Standard 1. Energy and mining use ISO 55001 roles, statutory appointments under mining law, and IOGP 510. The full estates are on the utilities, healthcare and energy pages.
Billing teams already sample released work. Contact centres already score calls. Control rooms already have authority levels. What is missing is a person who owns each agent's results and its changes.
What agents add
Supervision becomes part of the work, not a separate team. Staff who already work a queue take the agent's exceptions. In field evidence, supervisors who work inside the team did better than specialists.
Each agent's sponsor is recorded on its identity. Its credentials are scoped, they expire, and they need a fresh approval to renew. When a sponsor leaves, sponsorship moves to their manager automatically. An automated monitor ranks sessions by risk. The riskiest reach a person first.
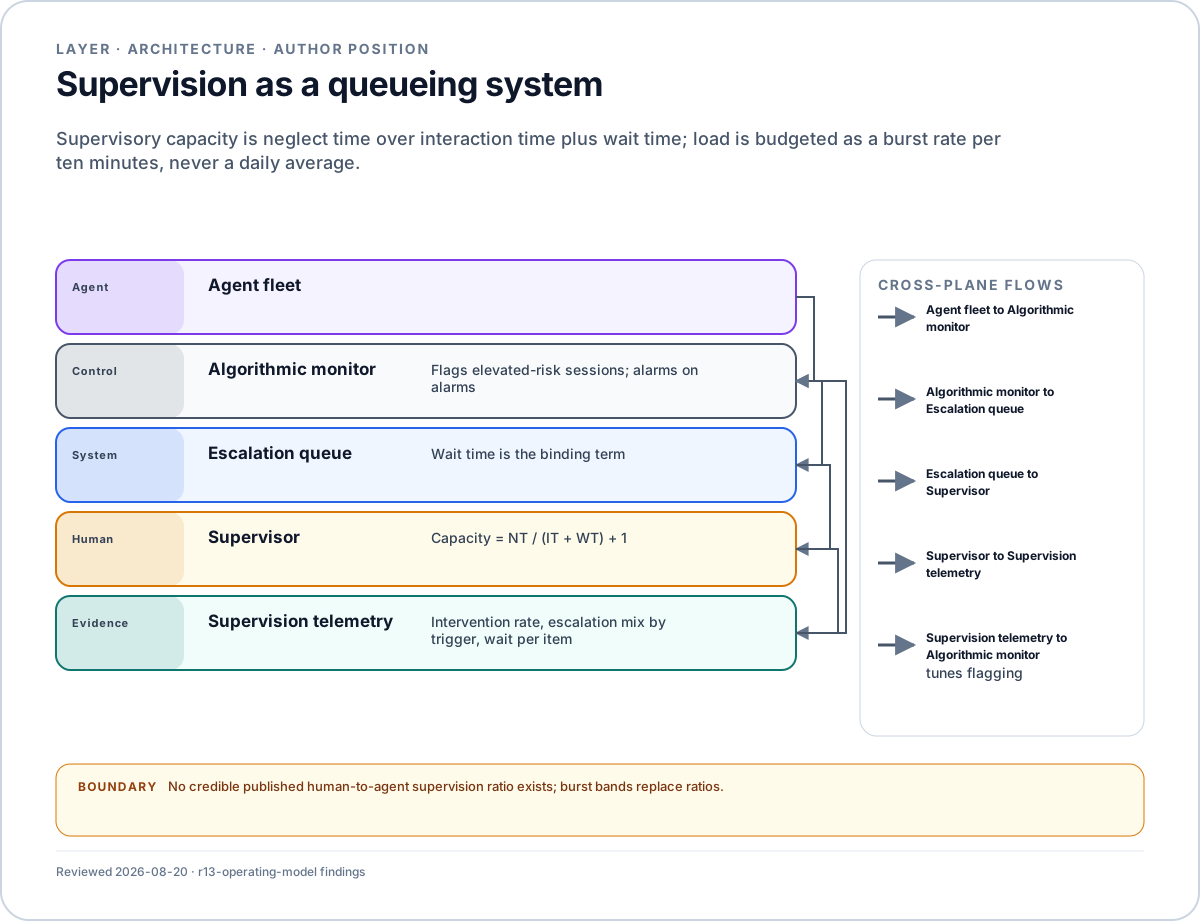
layer · architecture
Supervision as a queueing system
Supervisory capacity is neglect time over interaction time plus wait time; load is budgeted as a burst rate per ten minutes, never a daily average.
- 01Agent
Agent
Agent fleet
- 02Control
Control
Algorithmic monitor
Flags elevated-risk sessions; alarms on alarms
- 03System
System
Escalation queue
Wait time is the binding term
- 04Human
Human
Supervisor
Capacity = NT / (IT + WT) + 1
- 05Evidence
Evidence
Supervision telemetry
Intervention rate, escalation mix by trigger, wait per item
No credible published human-to-agent supervision ratio exists; burst bands replace ratios.
Diagram description: Supervision architecture from agent fleet through algorithmic monitoring and the escalation queue to the supervisor, with wait time explicit in the capacity model and telemetry feeding back. The map contains Agent fleet; Algorithmic monitor: Flags elevated-risk sessions; alarms on alarms; Escalation queue: Wait time is the binding term; Supervisor: Capacity = NT / (IT + WT) + 1; Supervision telemetry: Intervention rate, escalation mix by trigger, wait per item. Its connections are fleet to monitor; monitor to queue; queue to supervisor; supervisor to telemetry; telemetry to monitor for tunes flagging. Important boundary: No credible published human-to-agent supervision ratio exists; burst bands replace ratios.
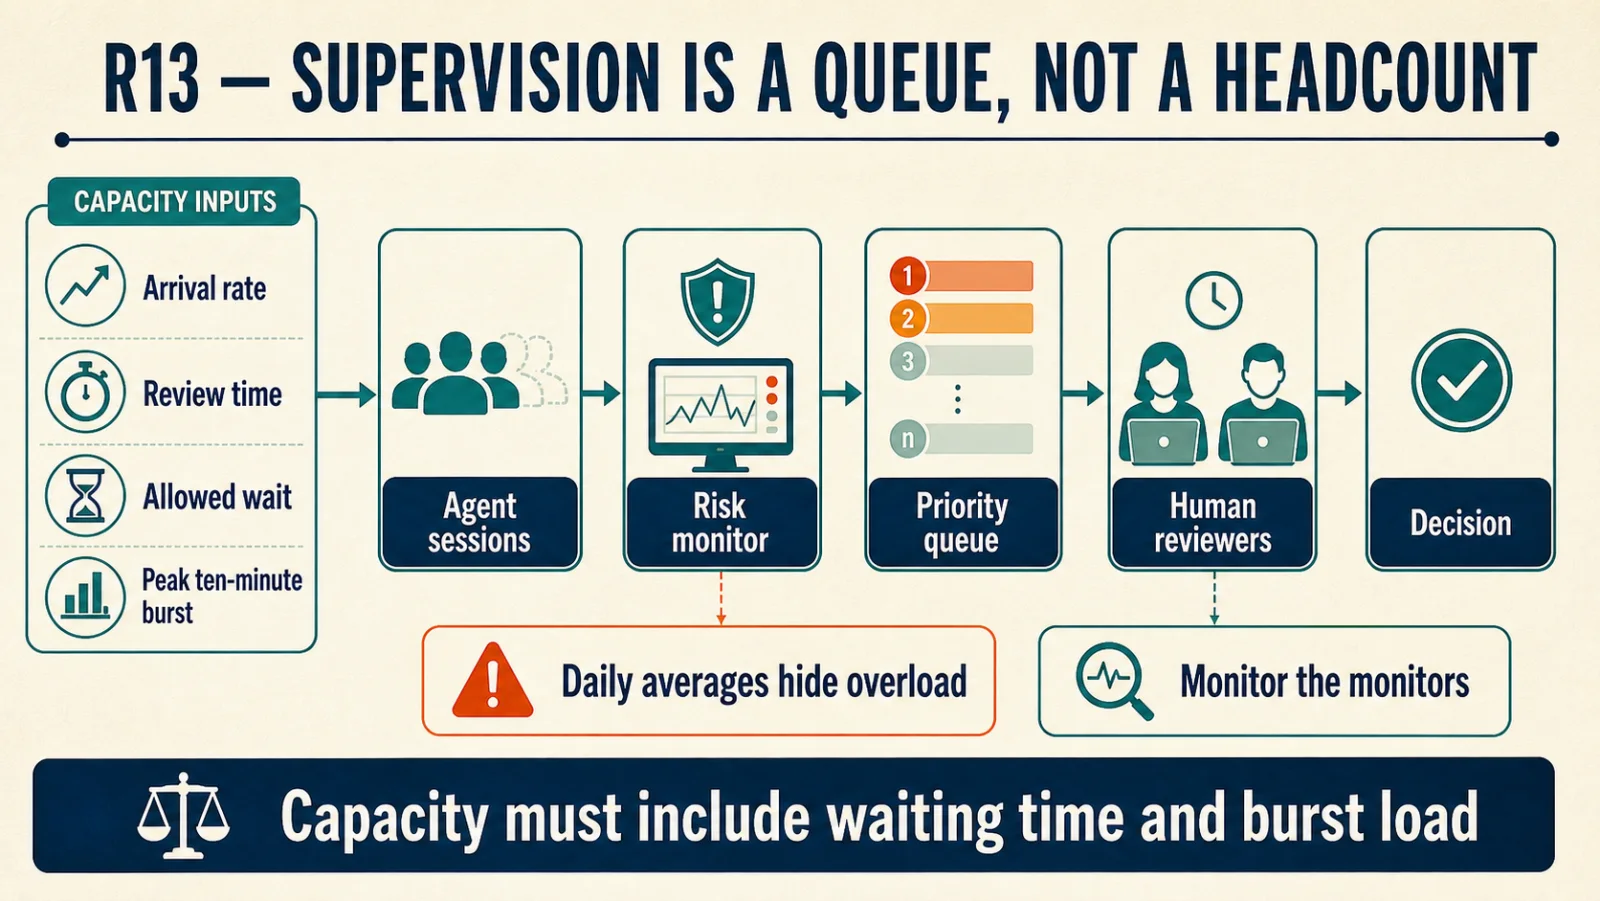
Supervision is a queue
Span of control is how many agents one person can supervise. It equals neglect time divided by the sum of interaction time and wait time, plus one. Neglect time is how long an agent can safely run alone. Interaction time is how long a person needs per intervention. Wait time is how long an item waits for that person.
The relation was measured with two, four, six and eight supervised units. Interaction time stayed nearly flat, from 18.19 to 15.74 seconds. Wait time grew about eightfold, from 8.71 to 67.58 seconds. Performance fell significantly between four and six units. At eight, each unit spent about half its time waiting.
Leaving wait time out overstates capacity by up to 67 percent. Even in designs that only raise exceptions, it overstates capacity by 36 percent. Slack helps. Two operators each supervising five units did better than one operator supervising ten. That held even with 20 percent extra time spent talking to each other.

Plan for the busiest ten minutes
Load is set as a burst rate: items per ten minutes at the busiest time. It is never a daily average. The only workload numbers written into standards come from alarm management. They give these bands per operator:
- Fewer than one item per ten minutes is very likely acceptable.
- One item per five minutes is manageable.
- One item per two minutes is likely over-demanding.
- More than one item per minute is very likely unacceptable.
After a major upset, more than one hundred items in the first ten minutes is excessive. The operator is then very likely to abandon the system. The same standards body says a ten-minute rate cannot be turned into an hourly or daily figure. It removed its per-day measure. Averaging had destroyed its meaning. A daily-average target will look fine on the dashboard and fail in every burst.
Where the stakes are highest, rules require more than one person per unit. Nuclear control rooms must staff several licensed operators per unit. A licensed operator must be at the controls at all times.
Make the right check the cheapest
People check agent output when checking is easy, not when they are told to. One study covered about 55,000 agent-written code-review comments in 342 repositories. The strongest sign that a person acted on a comment was an inline suggestion. Long, complex comments were acted on less often.
Automation bias means trusting the machine too readily. It rises as checking gets harder, and training or instructions do not prevent it. Design features that make a person pause before accepting an answer do help. In one study they cut acceptance of wrong output from 0.64 to 0.48. The designs that worked best were rated hardest and least liked by their users.
So make the correct check the cheapest action. Expect the design that works to be unpopular.
Measure supervision itself
Measure four things and read them together.
- Intervention rate and trend. A falling rate may mean tired reviewers, not a better agent.
- Escalation mix by trigger. Separate escalations raised by people from those raised by the monitor. Their outcomes differed in the largest field deployment.
- Wait time per item. Wait, not agent count, limits capacity.
- Verification cost per review. This is the design lever.
Add blind checks from time to time. People misjudge their own speed. In one study, people expected to be 24 percent faster. Afterwards they thought they had been 20 percent faster. Measured, they were 19 percent slower.
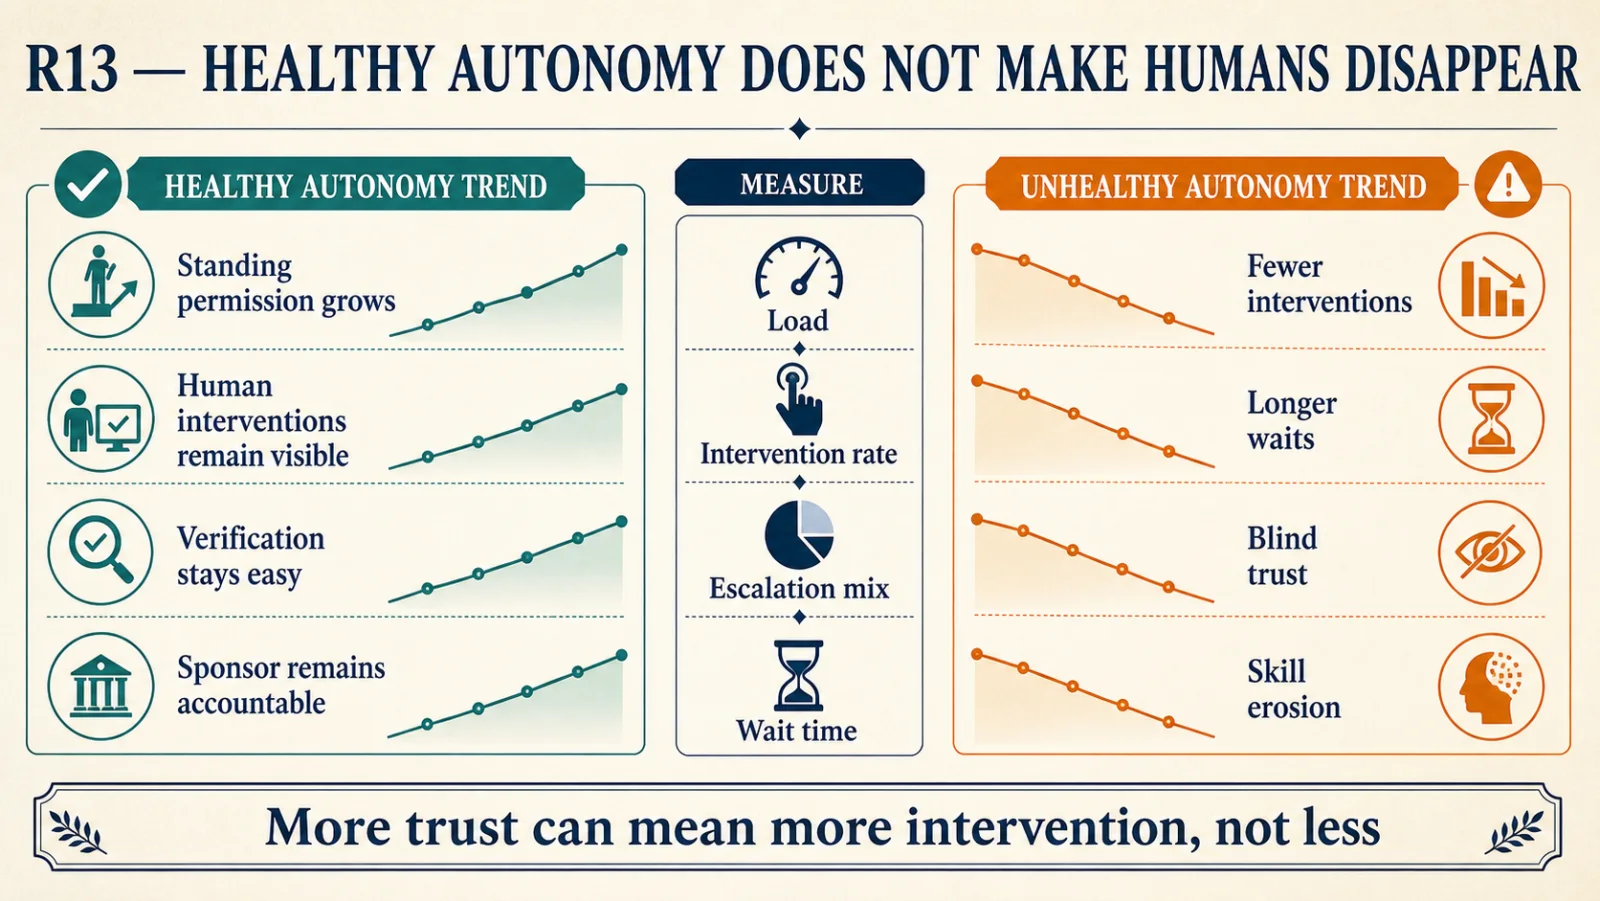
Expect more interventions as trust grows
As trust grows, standing permission widens and interventions rise. This is calibrated oversight. In measured deployments, auto-approval rose from about 20 percent to above 40 percent with experience [vendor]. Over the same period, interrupt rates rose from about 5 percent to about 9 percent [vendor].
Rising interventions with wider permission is the system working. Falling interventions with wider autonomy is the warning sign. Autonomy is set per task on the autonomy contract.
A named sponsor is not a control on its own. In one test, a phished employee's prompt told an agent to read cloud credentials and post them outside. It worked in 24 of 25 attempts. The sponsor's name on the agent stopped none of them.
How to organise the teams covers who builds the agents and who runs the platform. It also sets out three support levels for teams.
What must be true before an agent touches it
Before an agent works on live cases, these hold. Approvals and stops are enforced outside the model, at the tool gateway and the policy decision point. Enforcement outside the model shows where. A person's decision is enforced there. It is not a request written into the agent's prompt.
- A named sponsor and owner. Both sit on the agent's registry record, with transfer when a sponsor leaves.
- Capacity sized at burst. The queue is sized from measured wait times, for the busiest ten minutes.
- A degraded mode. When a burst passes capacity, the agent pauses, narrows its permissions or returns work to people. It recovers only after the backlog clears and the work is checked.
- The oversight-capacity gate. Before an agent moves to managed autonomy (A4) or governed lights-out (A5), oversight must hold at burst. Capacity is calculated with wait time, set as a burst rate, and measured in production. The autonomy contract sets out this gate under check that people can keep up.
- Zone actions stay with a named person or a fixed rule. Actions in the four deterministic zones never rest on the agent's judgement. Nor does a significant decision about a person.
- Supervision is measured from the first day. The four measures and the blind checks feed the weekly review on Operate.
Choices and their verdicts
Each choice below is the common choice, tested against the simplest credible alternative. The full records are in the decision catalog.
- Treat agents as workforce or as tools (decision record CD-22). Keep the accountability, and drop the personnel metaphor. The strongest field deployment names an accountable person per agent, with no place on the org chart.
- Set a fixed ratio of agents to supervisors. No credible published ratio exists. Size from your own measured wait times and the burst bands instead.
- Run a centre of excellence or enterprise architecture. Neither label fits. How to organise the teams gives the structure and its exit tests.
Concerns this layer must honour
This layer owns one of the ten cross-cutting concerns and carries duties for six more.
- Safety and oversight (owned here). Supervision is sized as a queue, checks are cheap, and staff rotate to keep their skills.
- Identity and access. Each agent has a named sponsor that transfers when the sponsor leaves. Accountability is not the same as control.
- Observability. Load, intervention rate, escalation mix and wait time are measured per item.
- Traceability and audit. Supervisors' decisions and their reasons are recorded.
- Privacy. Data about supervisors' performance is worker data, with its own duties.
- Cost. Supervision time counts in the cost per resolved outcome.
- Resilience. Staff practise the work without the agent, and every sponsor has a successor.
Evidence and limits
The span-of-control measurements, the alarm bands, the code-review study and the forcing-function results are peer-reviewed or published in standards. The auto-approval and interrupt trends come from platform telemetry, marked [vendor].
No credible published human-to-agent supervision ratio exists from any source. A major vendor introduced the measure as a management idea. It published no figure in two annual editions. Every number in circulation is an extrapolation. Several widely repeated figures trace to untraceable or misquoted origins, and this guide leaves them out.
So size supervision from the burst bands and your own measured wait times.
Next step
See this layer at work in investigating a water-network anomaly. The weekly checks are on Operate, and the teams are on How to organise the teams. Reading the layers in order? The next one is agent data engineering (R14).
Explore this topic
- Operating model findings
- Sources
- Products named for orientation, on the one-page wall chart
Re-verify. Whether any credible measurement of agent-supervision capacity is published. Whether a 2026 finding on vigilance holds. Vigilance decrement is the fall in attention over a long watch. The finding says it is a shift in bias, not a loss of sensitivity. If it holds, it would change interventions aimed at better detection.
Cite this page
Written by Murali Sid, Founder and AI Systems Architect, last updated 15 October 2026. Licensed CC BY-SA 4.0, so quote it freely with attribution.
Murali Sid (2026). Operating model and supervision. Agentic Architecture Skills. https://www.agenticarchitectureskills.com/layers/r13-operating-modelMachine-readable version of this page: /layers/r13-operating-model.md
Observability and FinOps
What the observability layer must provide for agents: a record of every run that the agent cannot change, a tested gate on every change, and a budget with hard caps that a named sponsor owns.
Agent data engineering
What the data engineering layer must provide for agents: curated collections with named owners, documents read with their source attached, access rules that travel with every copy, checked memory, and deletion that reaches every copy.