Investigate a water-network anomaly
How a water utility's control room investigates an alarm today. How an agent can gather the evidence from a read-only copy of the data while people decide and act.
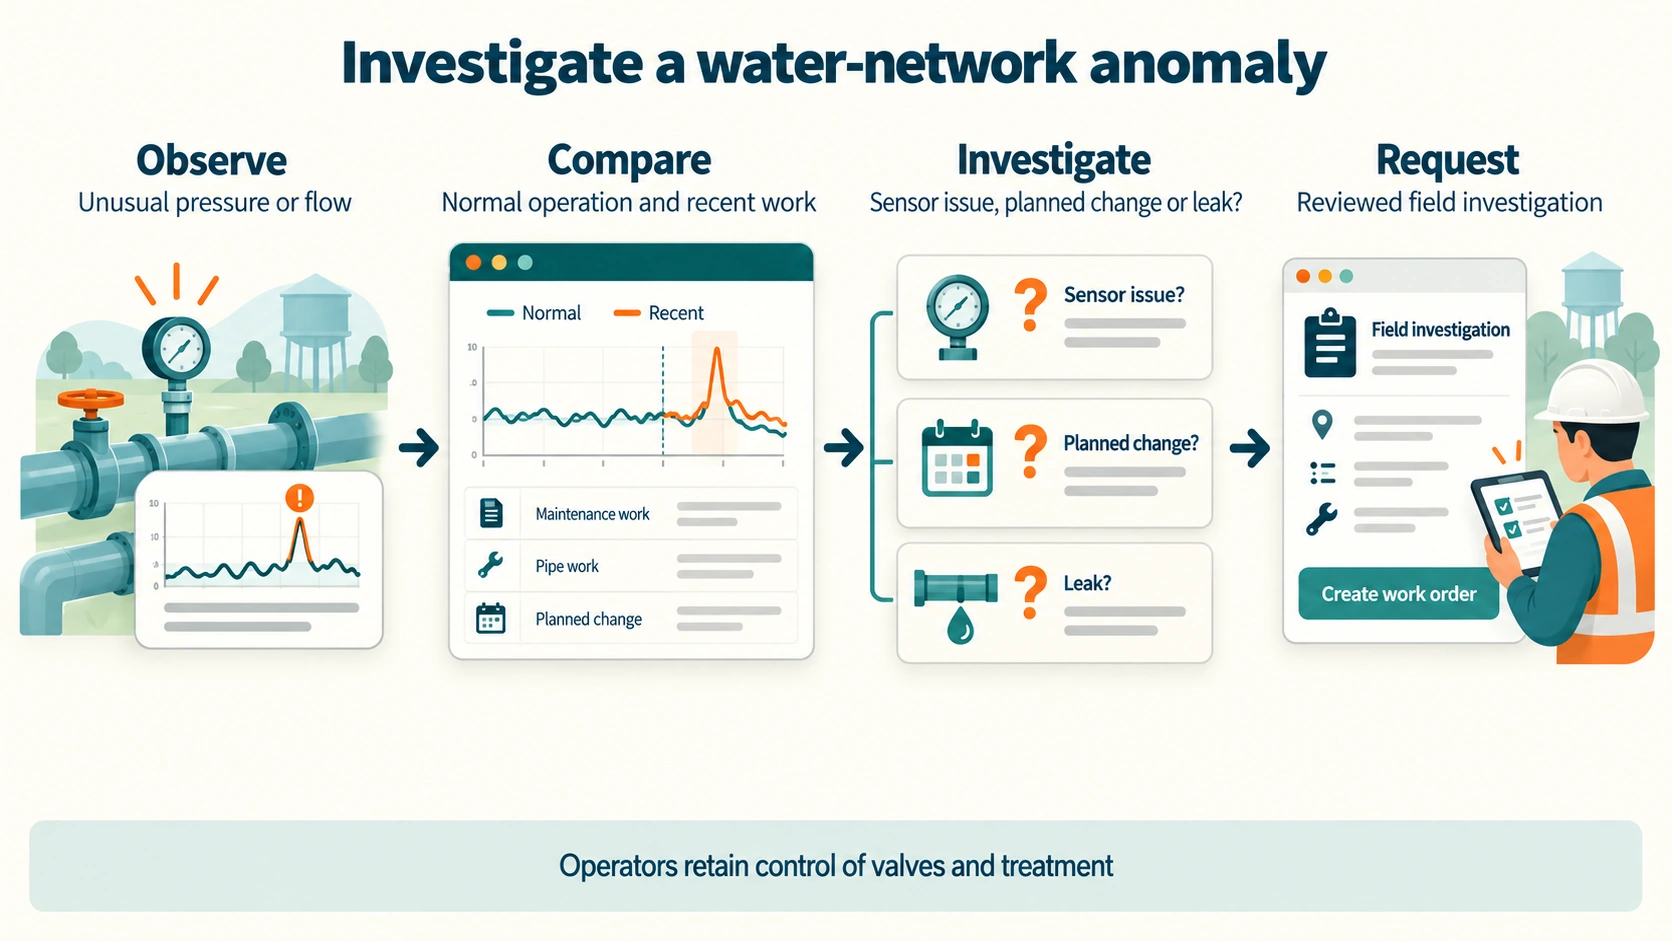
An alarm fires on a water network. The control room operator must work out what it is. It could be a sensor fault, planned work, or a real issue such as a burst main. The water utility owns this work. Its control room watches the network, an engineer investigates, and field crews isolate and repair. An agent can gather the evidence from a read-only copy of the data and propose a view. The operator decides. The agent has no write path to any control system.
The systems involved
This work touches eight of the fourteen layers. The table names the systems at a metropolitan water utility. Vendors in brackets are examples, not a claim about any one company. The utilities page shows the full estate.
- Systems at a water utility
- SCADA, the control-room system that monitors and operates pumps, valves and treatment (Schneider Geo SCADA Expert, AVEVA, Citect). Remote terminal units and PLCs. The historian (AVEVA PI). Network event analytics (TaKaDu, StormHarvester). Hydraulic models (InfoWorks WS Pro, WaterGEMS). Field mobility
- Systems at a water utility
- A separate operational technology (OT) network for control systems. Telemetry radio or cellular to pumps, reservoirs and plants. Low-power networks for sensors
- Systems at a water utility
- A one-way OT to IT data path through a buffer zone, or DMZ. An IoT platform for sensors. The integration bus
- Systems at a water utility
- The asset system (IBM Maximo, SAP PM): work orders and calibration records. GIS (Esri). The customer billing system (CIS). The lab system (LIMS)
- Systems at a water utility
- The CRM and contact centre. SMS and web notices for outages
- Systems at a water utility
- The shift log, email and Teams. A paper logbook in some control rooms
- Systems at a water utility
- Guaranteed service levels, drinking water obligations, and reports to the economic, health and environment regulators
- Systems at a water utility
- Control room shifts with operator authorisation levels. Alarm roles under the ISA-18.2 alarm management standard
How it runs today
This is the process at a metropolitan water utility in Australia or New Zealand. It is typical practice, not a survey of one utility. Work starts from a SCADA alarm, an analytics alert, or customer calls. A SCADA alarm can flag pressure, unusual flow, a reservoir level, a pump trip or a chlorine reading.
- A signal appears. SCADA raises an alarm on the operator's screen. It arrives over telemetry, often using the DNP3 protocol. An event analytics platform can also raise an alert built from historian data.
- Acknowledge and look. The control room operator acknowledges the alarm and reads the SCADA screens and historian trends.
- Check the sensor. The operator checks SCADA communications status and calibration records in the asset system. Often this means a phone call to the instrument technician.
- Check planned work. The operator checks open work orders, the planned interruption list and the shift log. This means screens, email, Teams and a logbook.
- Check customer contacts. The operator or the contact centre looks in the CRM for calls about no water or low pressure.
- Form a first view. The operator decides: sensor fault, planned work, or a possible real issue. No system holds this step.
- Investigate a real issue. The network engineer on call uses GIS, the hydraulic model and the historian. The engineer runs the model for the zone.
- Raise work. The operator or engineer raises an emergency work order in the asset system. Field mobility sends it to a crew.
- Isolate and repair. The field crew operates valves on site, under procedure.
- Tell customers. The contact centre or communications team sends SMS and web notices. Guaranteed service levels are tracked in the CIS.
- Respond on water quality. The water quality team samples the water and records results in the LIMS. It notifies the health regulator where required.
- Close and report. The engineer and compliance write the incident report. Service level payments are credited through the CIS. Performance is reported from the warehouse.
For a sensor fault, steps 7 to 11 do not happen. The operator raises an instrument maintenance work order instead.

Handoffs
The control room hands to the instrument technician, and to the network engineer. The engineer hands to the field crew. The control room hands to the contact centre and communications. Any of them can hand to the water quality team. Operations hands to compliance.
Reporting
- Guaranteed service levels. In Victoria, an unplanned interruption not restored within five hours is a common payment trigger. The obligations sit in the Essential Services Commission's Water Industry Standard. Clause 18 covers interruptions and clause 20 the payments.
- Performance reporting to the state regulator, and national benchmarking of urban water utilities.
- Drinking water quality reporting to the health regulator.
- Internal dashboards on bursts, leaks, response times and water lost from the network.
Cycle time and volumes
- A metro network raises hundreds to thousands of alarms a day. Many are nuisance alarms (typical, unsourced).
- AWS says finding a root cause typically takes 25 to 40 minutes when an engineer queries three or four systems. It gave no source (AWS, 1 September 2026) [vendor].
- Unitywater reported a 66 percent cut in the time to detect and repair network events with TaKaDu. The article is older and undated, and was read as a search excerpt [vendor].
- No Australian or New Zealand utility was found that publishes alarm counts or investigation times.
Pain points
- Alarm floods and nuisance alarms.
- Context spread across four or five systems.
- Planned work is not linked to the sensor tags it affects.
- Sensor health is often unknown until someone checks.
- A single operator on a night shift.
- Know-how sits in experienced operators' heads.
- False leak alerts wear down trust in analytics.
How agents run it
The design keeps the agent on the information path. It reads a one-way copy of alarms and trends, outside the control network. The closest published pattern is an AWS reference design of 1 September 2026 [vendor]. It reads work orders, historian trends, a ticket database and manuals, all read-only. It does not write to control systems.
- Receive the signal. Agent. It reads a copy of alarms and events from the historian or event analytics. The copy is one-way and sits outside the control network. It writes nothing.
- Pull the trends. Agent. It reads the historian through its API or an MCP connector, read-only. It pulls the tag, its neighbours and similar past periods. It writes evidence.
- Check the sensor. Agent. It reads communications status, data quality flags and calibration dates from the asset system. It writes evidence.
- Check planned work and contacts. Agent. It reads open work and planned interruptions from the asset system, the digital logbook and the CRM. It writes evidence.
- Propose a view. Agent. It writes an advisory assessment in the event console, shown apart from real alarms. The view is sensor fault, planned work, or a possible real issue. It lists the checks that would tell them apart. The operator decides.
- Draft sensor work. Agent. For a sensor fault, it writes a draft notification in the asset system. The operator or a planner approves it there.
- Handle a real issue. The engineer leads. The agent drafts the work order and the customer notice from the model and GIS. The engineer or operator approves. Crews isolate.
- Support a water quality response. Agent. It reads lab results from the LIMS and writes a draft summary. A named officer decides notices and any regulator notification.
- Learn. The team that owns the agent updates the reference set offline from case outcomes. Each change is approved before release. The learning flywheel describes this loop.

What stays with a person, and why
- Any control action on pumps, valves or treatment. This is the safety actuation zone.
- Isolating mains. Crews act under procedure.
- Boil water notices and other public health advice. These are regulated decisions.
- Notifying the health or environment regulator. It is a formal record.
- Sending an emergency crew. It commits people to a site at any hour.
Where the evidence is kept
- Agent traces, in a store outside the agent.
- The SCADA alarm journal and the historian. They stay the operational record, and the agent does not change them.
- The asset system's audit trail for any work the agent drafted.
- The control room logbook.
What changes in the systems
- A one-way feed of alarms and trends to the agent, through the DMZ.
- An advisory field or panel in the event console or the asset system notification.
- A work queue for "agent assessed" events.
- A read-only identity on the historian and a create-notification identity in the asset system. Both sit in the security and identity layer (R10).
- An OT security review of the new zone and conduit, under IEC 62443.
- A digital logbook, where the log is still on paper.
What does not change
- SCADA.
- Alarm configuration and alarm management under ISA-18.2.
- PLC logic and treatment control.
- Drinking water obligations.
Who does this today
Water AI at named utilities reads sensor data and advises. In every case found, people decide what to do. No named utility was found using a language model to triage SCADA alarms. Status is as of 15 October 2026.
- Who
- Watercare (Auckland): 5,000 wastewater sensors with an AI layer that learns normal behaviour
- Date and source
- 18 August 2025, Watercare
- Stage
- Production rollout
- Status
- Advises. Staff decide on maintenance. A search excerpt names StormHarvester and Kallipr
- Who
- Sydney Water with UTS: acoustic leak AI, 80 percent accuracy within 200 metres
- Date and source
- 22 February 2023, Trenchless Australasia, search excerpt
- Stage
- Production
- Status
- Advises. Developer-reported figures
- Who
- Sydney Water: TaKaDu event management since 2015
- Date and source
- WaterWorld, undated, search excerpt
- Stage
- Production
- Status
- Advises. Contract extended, date not seen
- Who
- Hunter Water, Unitywater, TasWater, Gold Coast, Gympie: TaKaDu event management
- Date and source
- 2017 to 2018 articles, some undated, search excerpts
- Stage
- Production then
- Status
- No 2025 or 2026 update found
- Who
- Yarra Valley Water with Aqua Analytics: AI data loggers for leak detection
- Date and source
- August 2024 contract extension, search excerpt
- Stage
- Production
- Status
- No figures
- Who
- AWS reference design for alarm management on Bedrock AgentCore
- Date and source
- 1 September 2026, AWS [vendor]
- Stage
- Reference design at an unnamed North American utility
- Status
- Read-only. Work order creation is a possible extension
- Who
- AVEVA PI and CONNECT
- Date and source
- 20 May 2026, AVEVA [vendor]
- Stage
- Announced
- Status
- MCP integrations described as coming. A major CONNECT release is planned for Q1 2027
- Who
- Oracle Work and Asset Cloud Service: risk signals for water pipe failures
- Date and source
- 13 April 2026, Oracle [vendor], search excerpt
- Stage
- Announced
- Status
- Page returned an error
- Who
- Xylem: "AI recommends, humans decide, always"
- Date and source
- 2026, Xylem blog [vendor]
- Stage
- Statement
- Status
- Advocacy, not a deployment
Where this sits
Answer the four questions for this agent. Its role is assist: it prepares evidence for an operator. Its permissions are what its own credentials let it do. It can read a copy of alarms and trends, the asset system, the logbook, the CRM and the LIMS. It can write an advisory view and draft notifications. It has no write path to SCADA or any other control system.
On the autonomy contract, it is designed and permitted for delegated tasks (A2). It does a set task and a person decides. Its learning is curated learning (L1). People choose the past cases it learns from, offline, and approve each change.
Its impact sits next to the safety actuation zone, one of the deterministic zones. It never acts inside it. Its advice can still send a crew out, so people decide every action.
On the risk profile, it is Tier 2 (enhanced), because it writes drafts into a production system. It is Tier 3 (strict) if your data classification treats the telemetry copy as control-system data. Register it through the agent lifecycle, with a sponsor in network operations.
Measure the result
Measure confirmed issues, false alarms, and misses found in a sampled check. Track investigation time and full cost. Compare with the current alarms and the operator's current workflow before adding a more complex model.
Start with a trial
Take a historical set of alarms with the operators' conclusions as the reference. Run the agent in shadow mode, with its views hidden from the live console. Review its views with the control room. Then show views for one zone, with the operator deciding every case.
Evidence and limits
The current process is written from industry knowledge, not a survey of one utility. No Australian or New Zealand utility publishes alarm counts or investigation times. The only time figures come from vendors.
The named water deployments use statistics and machine learning, and they advise. The language-model investigation on this page has no named precedent. The AWS design is a reference, not a production result.
The national benchmarking point under Reporting was not checked against its source for this page. This guide recommends a one-way copy of OT data and no write path back, whatever the vendor offers.
Next step
Score this agent on the risk profile. Then return to utilities for the other worked examples.
Explore this topic
All sources checked on 15 October 2026 unless a date says otherwise. "Search excerpt" means the page itself could not be opened.
- Watercare's wastewater network smartens up with rollout of 5,000 sensors, 18 August 2025. Operator-reported.
- Trenchless Australasia, Sydney Water takes on more tech, 22 February 2023. Developer-reported figures. Search excerpt.
- WaterWorld on Sydney Water and TaKaDu, undated. Search excerpt.
- Water Online on Hunter Water and TaKaDu, 2018. Search excerpt.
- Smart Water Magazine on Yarra Valley Water and Aqua Analytics, August 2024. Search excerpt.
- AWS on intelligent alarm management with Bedrock AgentCore, 1 September 2026 [vendor].
- AVEVA World 2026 announcements, 20 May 2026 [vendor].
- Oracle on AI for utilities, 13 April 2026 [vendor]. Search excerpt; the page returned an error.
- Xylem on AI in water utilities, 2026 [vendor].
- Essential Services Commission, water industry standards. Search excerpt. Clauses 18 and 20.
- The Unitywater figure was read as a search excerpt. So was the Victorian five-hour trigger, from Greater Western Water and South East Water pages. No link was kept.
Cite this page
Written by Murali Sid, Founder and AI Systems Architect, last updated 15 October 2026. Licensed CC BY-SA 4.0, so quote it freely with attribution.
Murali Sid (2026). Investigate a water-network anomaly. Agentic Architecture Skills. https://www.agenticarchitectureskills.com/use-cases/water-operationsMachine-readable version of this page: /use-cases/water-operations.md
Prioritize vegetation inspections
How an electricity distributor turns imagery into vegetation work today. How an agent can carry a finding to a proposed work request that a planner approves.
Resolve billing exceptions without deciding hardship
How an energy retailer clears implausible meter reads and held bills today. How agents can run the same work, with a rule or a specialist approving every change. A water variant is included.