Represent places and changes over time
Use geospatial similarity while retaining the location and observation period.
The map answers one question; the inspection needs another
A utility finds an area whose vegetation representation changed between years. It is tempting to turn that result straight into a clearance warning. But a changed area does not, by itself, establish which tree is near which conductor, how large the gap is, or whether the observation reflects conditions today.
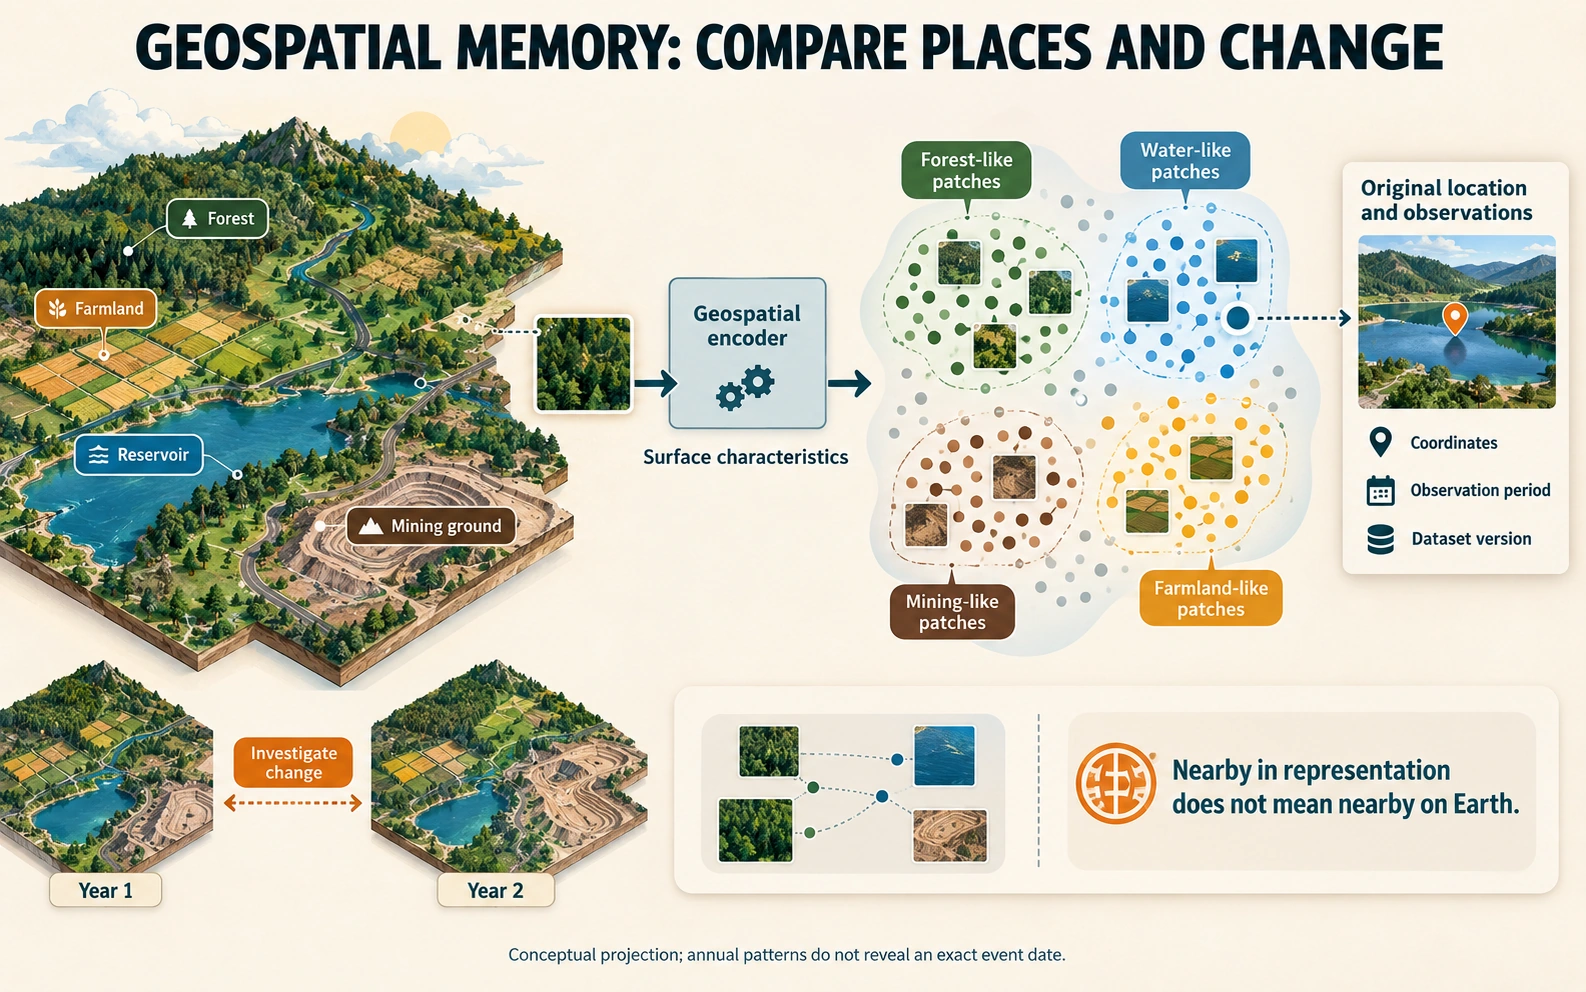
Use broad representations to guide investigation, then obtain the resolution, geometry, and freshness required by the operational decision. The value comes from narrowing the search while keeping the limits of the observation visible.
A representation can describe more than a photograph
Google's annual Satellite Embedding dataset describes each 10-meter pixel using 64 numbers that encode surface conditions over a year. Its documentation supports comparisons between years. That is useful evidence for exploring broad surface change; it does not supply the exact day an event began.
Keep the time interval explicit
Store the location, start and end of the represented interval, dataset version, and original observation references. Learned seasonal behavior and an exact date answer different questions.
Match resolution to the decision
A representation of a region can help identify an area worth examining. A particular tree's clearance from a conductor requires evidence with suitable spatial detail, geometry, and freshness. Do not treat annual regional change as a real-time clearance measurement.
Combine with the asset map
Join candidate findings to verified network assets and previous inspections. Check coordinate systems and observation quality. Then prioritize a suitable inspection or request better imagery.
Evaluate against field evidence
Measure how often candidate locations become confirmed findings, what is missed, and whether prioritization improves the existing process. See vegetation inspection.
External sources
- Google Satellite Embedding dataset documentation. Accessed 17 September 2026.
Continue the story: Represent how equipment behaves over time.
Cite this page
Written by Murali Sid, Founder and AI Systems Architect, last updated 15 October 2026. Licensed CC BY-SA 4.0, so quote it freely with attribution.
Murali Sid (2026). Represent places and changes over time. Agentic Architecture Skills. https://www.agenticarchitectureskills.com/memory/location-and-satellite-dataMachine-readable version of this page: /memory/location-and-satellite-data.md